When all the information needed for the plan is defined (stocks, parts, settings), you can start to perform the optimization of cutting layouts.
To start calculation of cutting layouts for the current plan, click the button ![]() in main toolbar. You can also run optimization directly by pressing F3 or by selecting "File > Start optimization" from the menu. You don't have to switch to Results form, the program does it automatically. During the optimization, you can watch its progress and the best results which are achieved.
in main toolbar. You can also run optimization directly by pressing F3 or by selecting "File > Start optimization" from the menu. You don't have to switch to Results form, the program does it automatically. During the optimization, you can watch its progress and the best results which are achieved.

You can stop optimization process at any time by clicking the button ![]() in the main toolbar or by pressing Esc. In such case following confirmation dialog appears.
in the main toolbar or by pressing Esc. In such case following confirmation dialog appears.

If you click the button [Yes], program will stop the optimization and the values will be saved to the plan. Previous results will be overwritten by values which were found in the moment the optimization process was interrupted. If you click the button [No], the optimization will continue.
When optimization is finished, the best cutting layouts will be automatically entered to the plan. The cutting layouts which were saved the last are always stored for next potential use (additional printing of reports, statistics, etc.).
|
Tip: When you choose particular plan in Plans form and you click the Results tab, you can immediately go over cutting layouts and summary of data which were saved the last. |
|
Tip: If the achieved results fulfill your needs and the optimization is not finished, you can stop it and use these results in the plan. |
Layouts
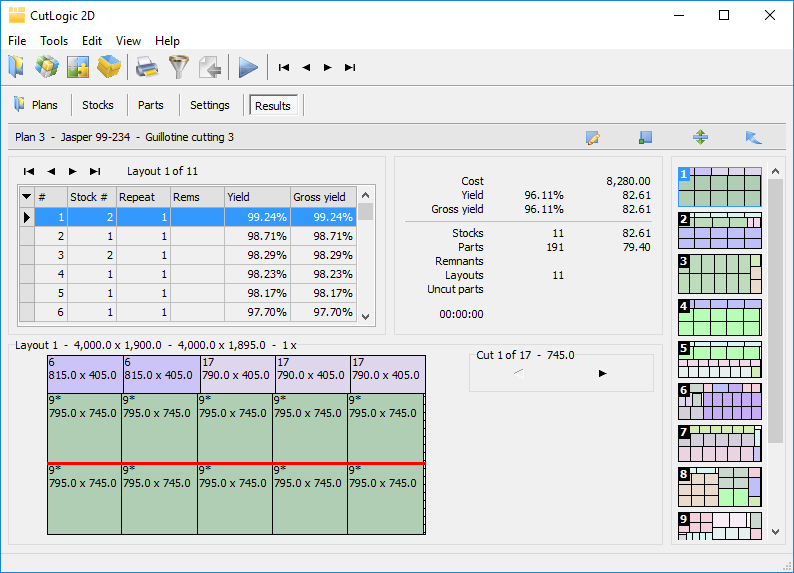
Following data grid shows the cutting layouts which were calculated by the program and user is immediately able to see their overview.

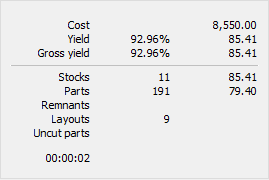
Summary
Here are complete information about the progress of calculation and currently achieved values of an active project (Cost, Yield, Gross yield, Stocks, Parts, Remnants, Layouts, Uncut parts).
Column 1 |
Column 2 |
Column 3 |
Cost |
- |
Overall cost of the plan. |
Yield |
Achieved utilization in percentage taking into account produced remnants. [(Sum area of used parts / (Sum area of used stocks - Sum area of produced remnants)] |
Absolute value of achieved utilization taking into account produced remnants. [Sum area of used stocks - Sum area of produced remnants] |
Gross yield |
Achieved utilization in percentage not taking into account produced remnants. [Sum area of used parts / Sum area of used stocks] |
Absolute value of achieved utilization not taking into account produced remnants. [Sum area of used stocks] |
Stocks |
Number of stocks used in calculated cutting plan. |
[Sum area of used stocks] |
Parts |
Number of parts used in calculated cutting plan. |
[Sum area of used parts] |
Remnants |
Number of reusable remnants produced in calculated cutting plan without newly created remnant rolls. |
[Sum area of remnants] |
Layouts |
Number of layouts of calculated cutting plan. |
- |
Uncut parts |
Number of uncut parts (not used parts) in calculated cutting plan. |
[Sum area of uncut parts] |
Layout
Graphical representation of the layout which is currently selected.

|
Tip: When clicking on individual part of a layout, basic information about it is showed (part number, position in layout, size, edgebands). |
|
Tip: After double click on part or remnant, associated report is printed (e.g. label report). See more in Reports. |
It is also possible to browse between cuts. Red line in the layout image demonstrates currently selected cut. You can immediately know position (vertical/horizontal) of selected cut.

Toolbar
![]()
|
Starts manual layout editing. |
|
Enables you to immediately switch origin of layouts. |
|
Enables you to stretch/unstretch layout image. |
|
Enables you to switch layout image. This will hide Layouts and Summary tables and enlarge the graphic representation of currently set layout. To switch image it is also possible to use F5 shortcut. |
Scroll bar
Enables quick scrolling among individual layouts. Graphical representation also enables to get immediate overview about organization of individual parts in a layout.